Introduction
import ffn
%matplotlib inline
# download price data from Yahoo! Finance. By default,
# the Adj. Close will be used.
prices = ffn.get('aapl,msft', start='2010-01-01')
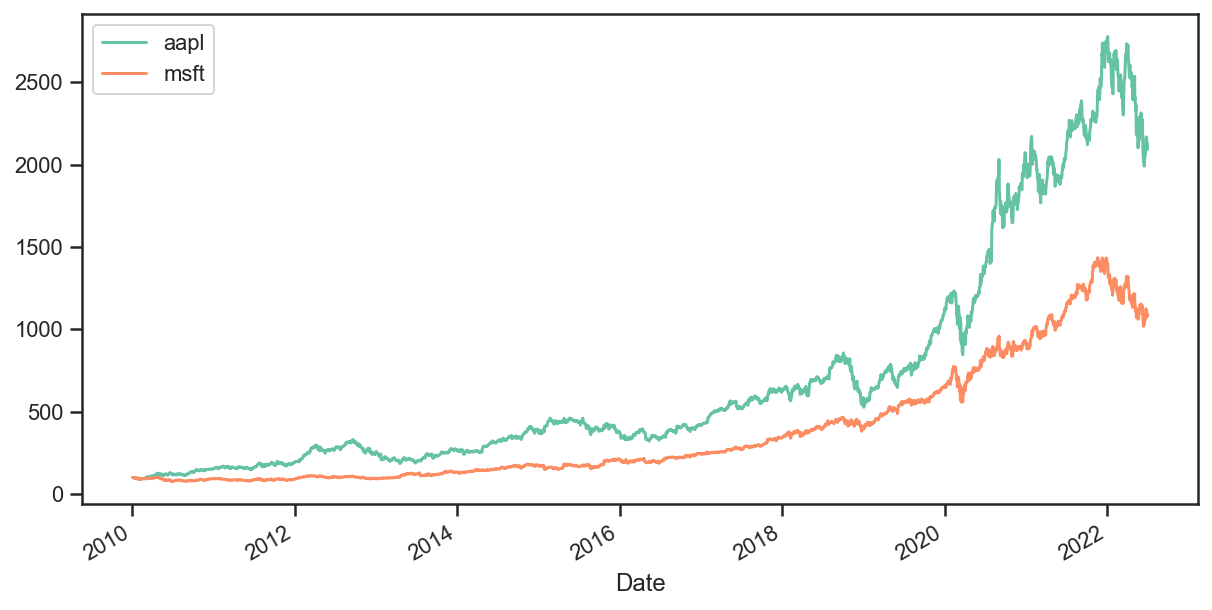
# let's compare the relative performance of each stock
# we will rebase here to get a common starting point for both securities
ax = prices.rebase().plot(figsize=(10, 5))
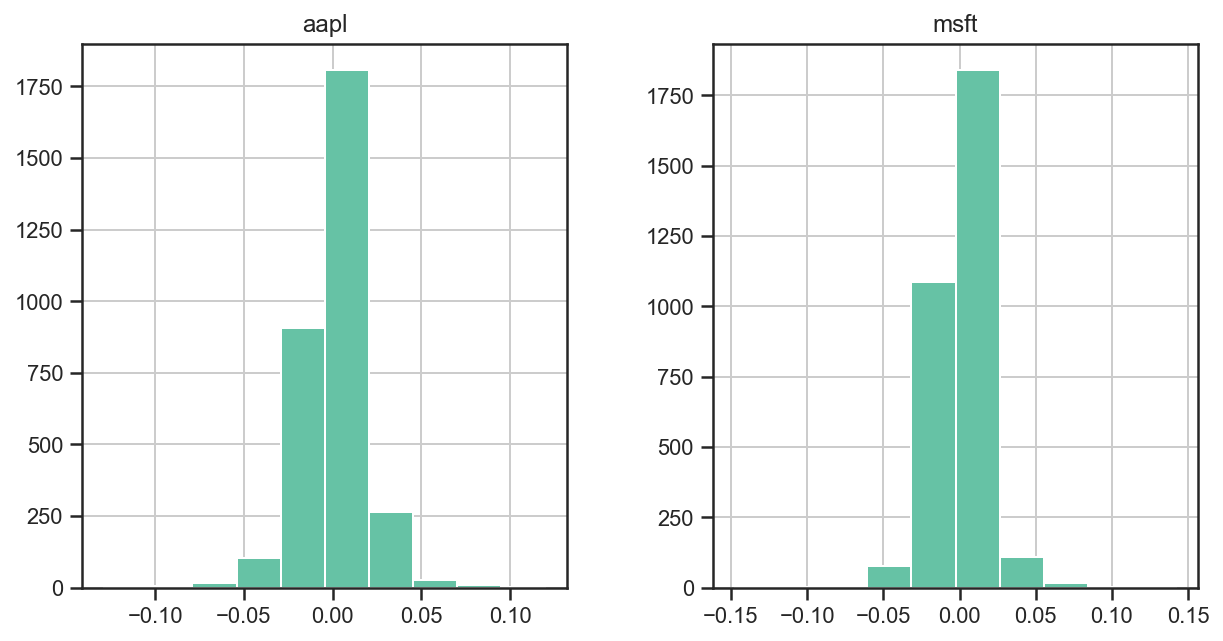
# now what do the return distributions look like?
returns = prices.to_returns().dropna()
ax = returns.hist(figsize=(10, 5))
# ok now what about some performance metrics?
stats = prices.calc_stats()
stats.display()
Stat                 aapl        msft
-------------------  ----------  ----------
Start                2010-01-04  2010-01-04
End                  2022-06-30  2022-06-30
Risk-free rate       0.00%       0.00%

Total Return         1992.09%    979.11%
Daily Sharpe         1.00        0.87
Daily Sortino        1.66        1.45
CAGR                 27.58%      20.99%
Max Drawdown         -43.80%     -29.08%
Calmar Ratio         0.63        0.72

MTD                  -8.14%      -5.53%
3m                   -22.98%     -17.98%
6m                   -23.07%     -23.98%
YTD                  -22.79%     -23.30%
1Y                   0.40%       -4.42%
3Y (ann.)            40.64%      24.96%
5Y (ann.)            32.03%      31.81%
10Y (ann.)           22.43%      26.28%
Since Incep. (ann.)  27.58%      20.99%

Daily Sharpe         1.00        0.87
Daily Sortino        1.66        1.45
Daily Mean (ann.)    28.42%      22.34%
Daily Vol (ann.)     28.40%      25.55%
Daily Skew           -0.10       0.01
Daily Kurt           5.34        8.60
Best Day             11.98%      14.22%
Worst Day            -12.86%     -14.74%

Monthly Sharpe       1.08        1.04
Monthly Sortino      2.26        2.16
Monthly Mean (ann.)  29.20%      22.31%
Monthly Vol (ann.)   27.00%      21.39%
Monthly Skew         -0.09       0.11
Monthly Kurt         -0.33       0.41
Best Month           21.66%      19.63%
Worst Month          -18.12%     -15.14%

Yearly Sharpe        0.84        1.04
Yearly Sortino       4.34        3.73
Yearly Mean          28.54%      25.14%
Yearly Vol           33.85%      24.20%
Yearly Skew          0.47        -0.60
Yearly Kurt          -0.27       -0.18
Best Year            88.96%      57.56%
Worst Year           -22.79%     -23.30%

Avg. Drawdown        -4.29%      -3.21%
Avg. Drawdown Days   29.95       25.20
Avg. Up Month        7.58%       5.39%
Avg. Down Month      -5.20%      -4.53%
Win Year %           75.00%      83.33%
Win 12m %            80.58%      90.65%
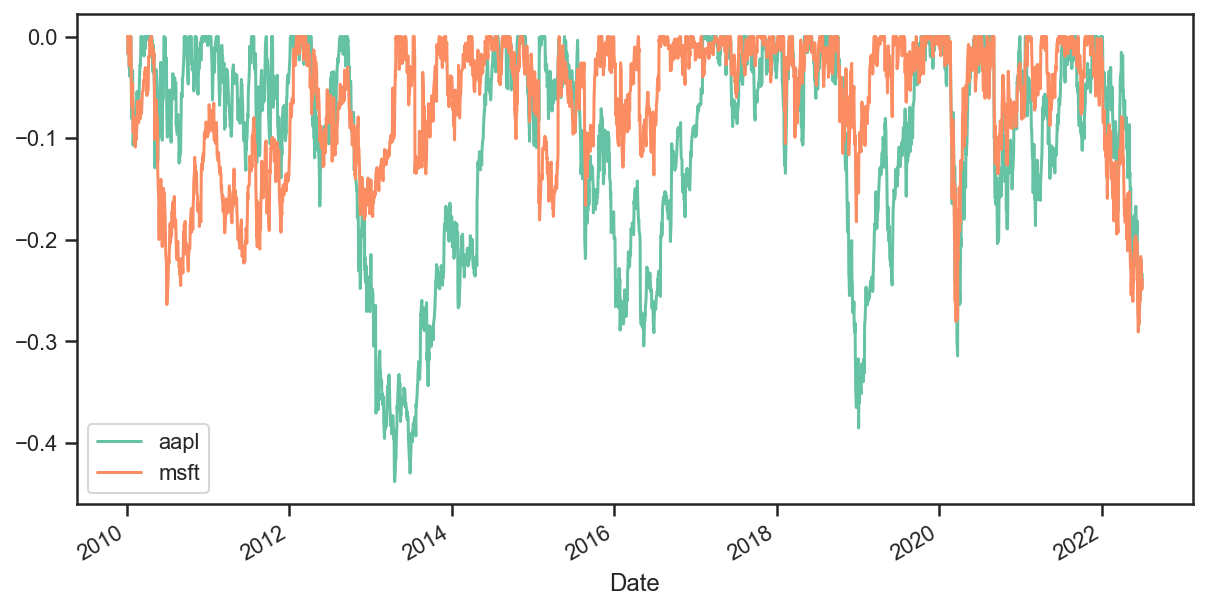
# what about the drawdowns?
ax = stats.prices.to_drawdown_series().plot(figsize=(10, 5))